Drone Flight Stats - Part 1
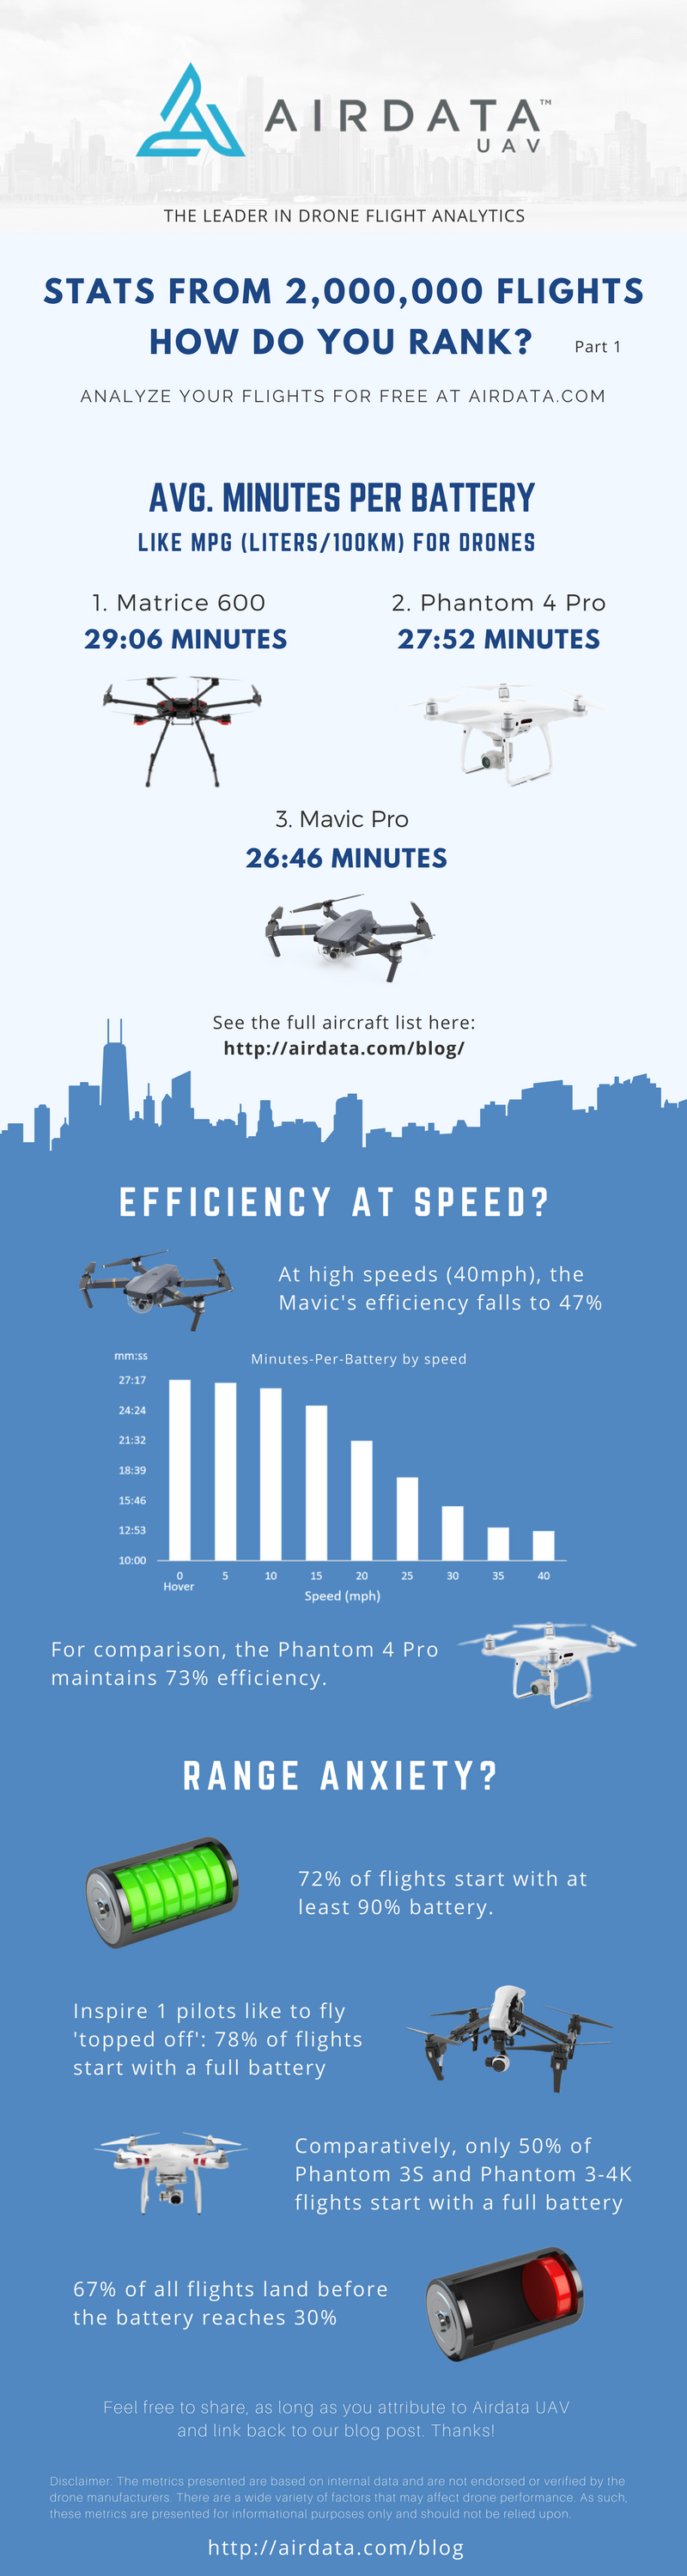
MPB: Minutes Per Battery
Like MPG (Liters/100Km) For Drones
How efficient are your drone flights?
We took a look at our over 2,000,000 flights to derive an average minutes per battery (MPB) to see how different drone types performed. The infographic to the right shows some of our summary findings.
Average MPB is, for drone pilots, equivalent to miles per gallon (MPG) for cars. As with MPG for cars (or Liters per 100km in many parts of the world), there are many factors that can affect MPB, like wind, speed, air temperature, and time spent ascending or hovering, etc. Other systems on the drone, like the camera and radio, consume power from the battery as well.
Interestingly, factors like weight and aircraft design have an impact on MPB, but not always in a straight-forward way as you might expect. For example, you might expect a smaller drone to maintain efficiency better at higher speeds, but sometimes smaller aircraft travel at a steeper angle, consuming more power with a quicker drop in efficiency. Ultimately, because the stabilization technology in the camera gimbal is so good, pilots can’t see when the drone is really working hard to maintain its position, or struggling due to high winds.
The MPB metric as calculated from our aggregate flight data measures the maximum potential flight time that could be achieved if the battery has 100% charge at take-off and lands at 0%, completely consuming the charge.
Always leave extra power in reserve
To be very clear: WE DO NOT RECOMMEND YOU TRY TO FLY UNTIL THE BATTERY REACHES 0%. Unlike when your car runs out of gas and you can coast to the side of the road, when the battery runs out, the drone will fall from the sky. Also, completely discharging a battery to 0% can cause permanent damage to the battery.
Most flight applications have an automatic return-to-home (RTH) feature which, when the battery reaches a certain level, will bring the drone back to safely land. Still, pilots should pay very close attention to their battery levels during flight to ensure they always have enough power to return the drone and land safely.
As mentioned previously, the stabilized video feed from the drone can distort how hard the drone is working in flight. Be mindful of your flight environment, as a tail wind on the flight out, will be a head wind on the return. Also, batteries degrade over time, so it’s important to monitor your battery performance closely and follow the manufacturers’ recommended battery maintenance.
Be mindful of your flight environment and don’t assume the battery consumed on the outbound will be the same for the return home:- Wind: As mentioned previously, the stabilized video feed from the drone can distort how hard the drone is working in flight. A tail wind on the flight out, will be a head wind on the return.
- Ascending consumes the most power: When the RTH feature is activated, the drone will typically ascend to a higher altitude before traveling back to the home point. Ascending consumes the most energy, even more than flying fast. As such, be sure you've set the RTH altitude at a safe height, but not too high.
- Batteries degrade over time: It’s important to monitor your battery performance closely and follow the manufacturers’ recommended battery maintenance. BTW, we'd be happy to help you with this ;-)
Now to the numbers
To get to these MPB averages, we examined the average horizontal ground speed of all flights, regardless of the distance, speed, altitude change or flight style. The data was cleansed to eliminate potentially erroneous data or extreme outlying data points. Speed was then analyzed within a range of 5 mph. We then calculated the average MPB for each speed range and each drone type. In the bar charts below, orange represents a drop in MPB of 10% or more from MPB at Hover.
The results of the most popular drones are shown below, ranked by Overall MPB, which is a an average of all flights and all speeds.
The Top MPB Chart
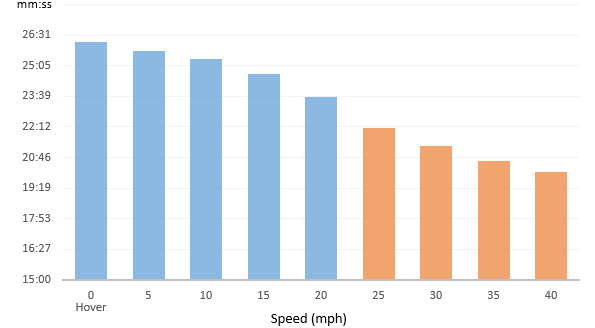
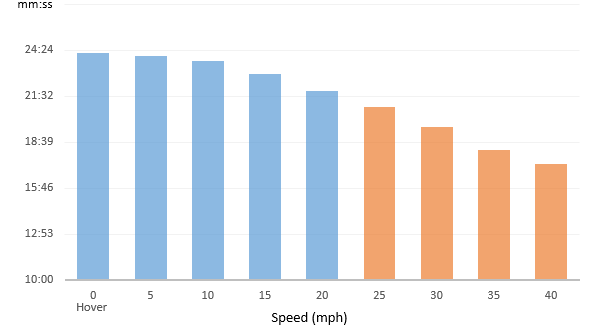
1. DJI MATRICE 600 | Overall MPB: 29:06 |
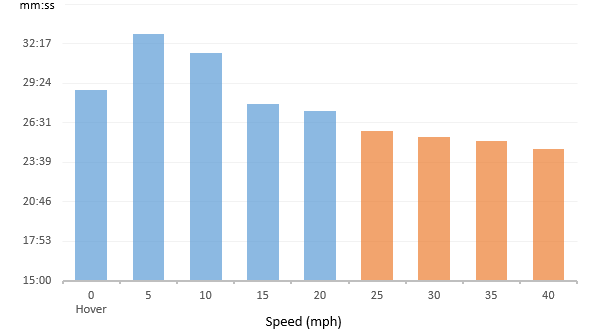
Interestingly, the Martice 600 is the only aircraft that is working significantly harder while hovering than while moving (12% less efficient). This may be due to the aerodynamics of the aircraft as it expends energy to stay in one place.
The 6 propellers will suck air from above and push it downward to maintain its altitude. By flying the drone in any direction, it may require less effort to pull air through the propellers.
Now, while the drone is in motion, it will be tilted, requiring additional force to be exerted from the propellers to maintain altitude. For the Matrice 600, it appears that force is best balanced around 5 mph.
The Matrice 600 is able to maintain its MPB efficiency above 85% up to 40 mph.
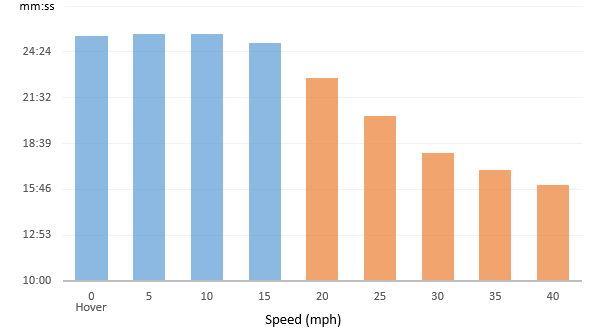
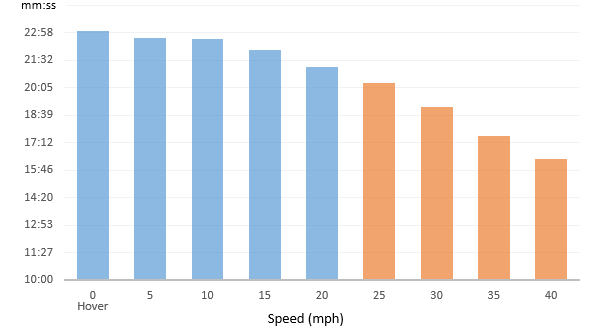
2. DJI P4 PRO | Overall MPB: 27:52 |
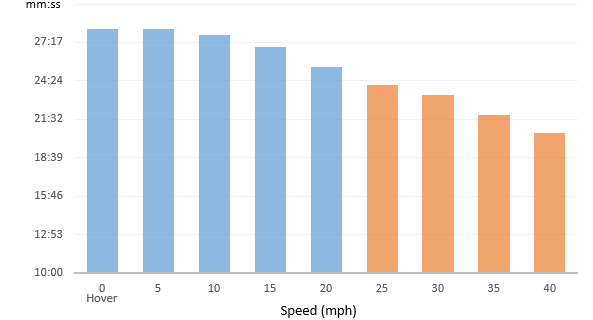
The Phantom 4 Pro maintains its efficiency well, showing only a loss of 10% between Hover and 20 mph. The efficiency drops to 73% at 40 mph, and the Phantom 4 Pro maintains high efficiency across all flights with an overall average of 27:52 MPB.
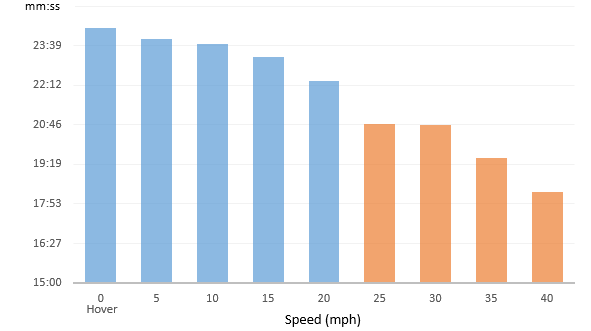
3. DJI MAVIC PRO | Overall MPB: 26:46 |
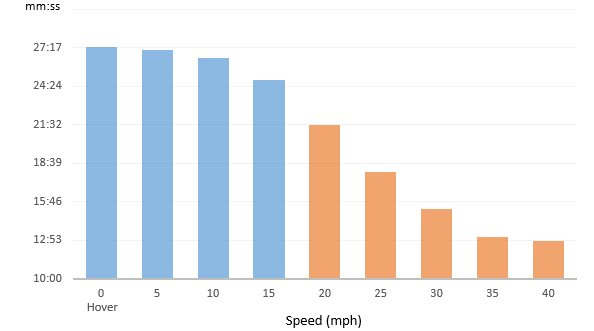
The Mavic shows a rapid drop in efficiency after 15 mph. This data would indicate that 'size matters'. The Mavic, as a smaller aircraft, will need to have to a greater flight angle in order to achieve higher speeds. As such, consuming power much more quickly the faster it flies: down to 47% of its efficiency when reaching 40 mph.
4. DJI P3 STANDARD | Overall MPB: 25:33 |
The Phantom 3S is able to maintain its MPB efficiency above 77% up to 40 mph.
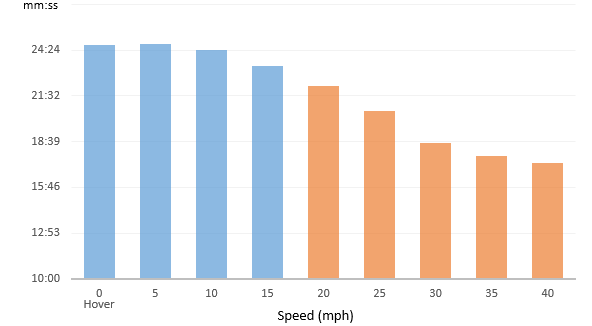
5. DJI P4 | Overall MPB: 25:20 |
The Phantom 4 also shows slightly lower battery efficiency while hovering than in motion (0.5% less efficient), but not the significant difference seen with the Matrice 600. The Phantom 4 sustains its efficiency at lower speeds with no significant drop until 15 mph.
6. DJI INSPIRE 2 | Overall MPB: 24:28 |
Generally, The Inspire 2 shows a fairly linear efficiency curve, maintaining 70% MPB efficiency at 40 mph.
7. DJI P3-4K | Overall MPB: 23:51 |
As expected, the Phantom 3-4K has a similar efficiency curve as the Phantom 3 Standard, with 76% efficiency at 40 mph. The difference in the average MPB (at all speeds) between the P3S and P3-4K may be due to additional energy used to operate the 4K camera.
8. DJI P3 ADVANCED | Overall MPB: 23:37 |
The Phantom 3 Advanced exhibits a linear decline in efficiency above 15 mph.
9. DJI P3 PRO | Overall MPB: 22:48 |
The efficiency curve for the Phantom 3 Pro is nearly identical to the P3 Adv. Both maintain 71% efficiency at 40 mph. Again, the difference in the average MPB (at all speeds) between the P3A and P3P may be due to additional energy used to operate the 4K camera.
10. DJI INSPIRE 1 | Overall MPB: 17:28 |
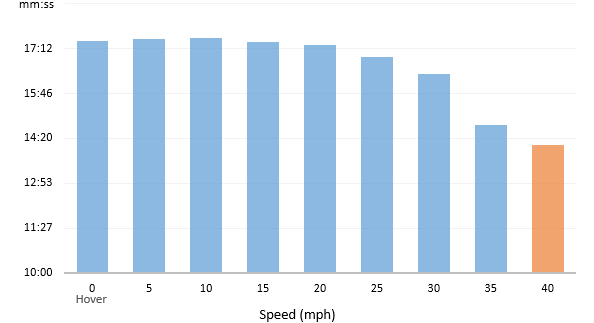
The Inspire 1 also is slightly more efficient in motion (at slow speeds) than hover. While the Inspire 1 has a relatively low MPB, it is able to maintain its MPB efficiency above 80% up to 40 mph.
11. DJI INSPIRE 1 PRO | Overall MPB: 15:54 |
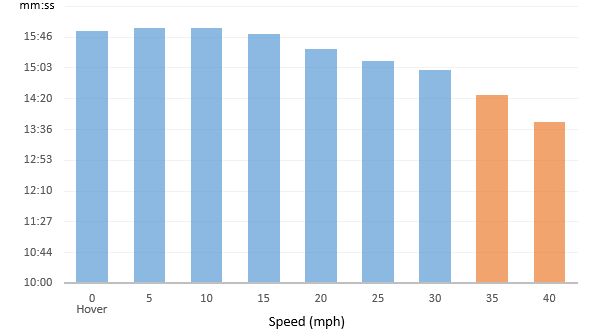
Although the Inspire 1 Pro comes in at a lower MPB of 15:54, it is able to maintain its MPB efficiency above 86% up to 40 mph.
*The metrics presented are based on internal data and are not endorsed or verified by the drone manufacturers. There are a wide variety of factors that may affect drone performance. As such, these metrics are presented for informational purposes only and should not be relied upon.
Please let us know your thoughts and comments below.
In our next installment, we'll explore some other interesting metrics around maximum speed achieved (which may surprise you), as well as data on flight times and distances.
Happy Flying!
Eran
Thanks for sharing. Good to know.
Really interesting guys. Thanks for sharing and keep it up!
Great info, thank you for this.
Battery life v. weight, please.
Very nicely presented. Thanks!
It would seem that having outstayed our welcome and now it is marginal if a RTH would make it home , it would be best to fly as fast as possible for max range. Why does the P3P return to home at 21 mph?
Great info...thanks guys.
I wonder if a P4 with the new P4 Pro battery performs like a P4 Pro.
Is it possible to download the actual numbers used to create the bar graphs?
Very interesting investigation guys, will be wait part 2. Big thanks!
Could you share the raw m600 data with me?
First impression reading this is slower is better, but if you are going to cover distance for mapping, which is what I'm interested in, then faster is better! See my stats below.
Also, I would say the 0 low efficiency is due to the fact that payload weight is not accounted for as a covariate in this analysis. Most M600 flying hover for long periods are holding a large heavy expensive camera, and those that are going faster are flying smaller ones or just a GoPro or such. How much of the story here is based on weight differences? Would require a new dataset I think, or some equation that extracts hover efficiency for each flight input to estimate payload weight.
M600 Stats Time of flight Distance of flight
MPH Minutes Hour Miles Km
5 32.5 0.54 2.71 4.36
10 31.5 0.53 5.25 8.45
15 27.5 0.46 6.88 11.06
20 26 0.43 8.67 13.94
25 25 0.42 10.42 16.76
30 24.5 0.41 12.25 19.71
35 24 0.40 14.00 22.53
40 23 0.38 15.33 24.67
And if you add the https://www.dji.com/matrice600/info time here, of 35 minutes with no payload, then it fits right into the expected trend line. So, that first outlier is a result of heavy payload.
Which you can then fit to a cubic polynomial regression with and r2 of 0.99 (e.g., perfect) of:
Km = 2.9030382 + 1.2656373*m/s - 0.021376*(m/s-8.93333)^2 + 0.0014772*(m/s-8.93333)^3
Which makes the assumption of basically limited payload weight.
Now to include payload weight, so we can estimate flight time based on speed and payload weight. We take the statistics from the Matrice 600 spec website, or also available at:
http://bestdroneforthejob.com/drone-reviews/dji-matrice-600/
Percent Max Time At Speed = 0.8997619 - 0.0892857*Payload + 0.0095238*(Payload-3)^2
Again with an R2 of near perfect 0.99
With final integration of:
Inputs:
Speed (m/s): 12
Payload (kg): 2.5
% max time = 0.8997619 - 0.0892857*Payload + 0.0095238*(Payload-3)^2
Flight time (min) = (32.519376 - 0.6711334*Speed + 0.0343145*(Speed-8.93333)^2)*"% Max"
Distance (km) = ("Speed"*60*"flight time")/1000
which for this example is equation to:
Outputs:
% = 0.68
Flight time (min) = 16.83
Distance (km) = 12.12
Where do I find out what flight data "is Photo", "rc Throttle", etc mean?
We don't currently have a guide to the information that is downloaded in the .csv. "is Photo": if a photo is taken at a specific time. "RC Throttle": the position of the throttle knob on the remote. If you have any other questions, please reach out to us at support@airdata.com
Thanks for compiling this information and sharing it. This the kinda of data that can only come from the kind of program and expertise that you have developed.
I recently sold my Phantom 4 after 280 flights with every flight recorded and analyzed on Airdata. Before he drove off with my Phantom 4, I advised him to consider Airdata to monitor his aircraft and flights to protect his investment. With in two hours, the new owner flew it into a tree at a high speed. He contacted me hoping I would except responsibility for his crash. I exchanged text with him a few times inquiring about compass calibration as well as what tablet he used (I know nothing of android I only use IPad Air) and what parameters he had set. I finally had to tell him him that I did not see how I could take responsibility. My conscience is clear having analyzed my data on battery and aircraft. I gave him a demonstration flight in all modes. I flew in sports at 40 mph with high speed turns and extreme elevation changes and demonstrated Attitude Mode. I’m disappointed that he lost his aircraft in what seems to be a rush to first flight. My Airdata subscription is worth it’s cost to feel that I sold a fully functional aircraft.
Thanks.
Hello, MPB Charts are very interessing information, but depend of the temperature of the LiPo batteries. For low or very low temperatures, average MPB is more shorter and the risk of no sufficient power and crash is important. For your MPB Charts above, we don't know the temperature of flights or LiPo batteries.
Additional Statistics reports would be very interesting. MTBF of various models. What is the maximum flight time for various models before they stop reporting data due to a crash, failure or other malfunction.
i need book about drone